Showing posts with label Code. Show all posts

Friday, March 01, 2024

Project 21 - Code Doodle - Swarm Doodle (Introduction)

It’s been a while since I’ve built anything interesting in the Artificial Intelligence field and with all of the neural network / transformer / LLM nonsense going on right now, I wanted to go back to one of the parts of AI I love, swarm systems.

If you haven’t heard the term before, boids are a generic model for the way organisms swarm together. Think fish in a school or birds in a flock. Each animal has a pretty simple set of things its trying to do but sometimes the overall effect can be breath taking; think of a huge murmuration of starlings at twilight. Boids -- think they fly like a boid -- are a way to model how bunch of simple agents can create a very complex behaviour, and how small tweaks to an agents behaviour can change the way a whole system performs (think starlings compared to geese). They're a very old addition to the world of artificial intelligence, and they've also been extreamly important to the world of film making.

Walter Baxter / A murmuration of starlings at Gretna / 

That being said, it’s been a very long time since since I’ve messed around with swarms (or boids) and I’m quite rusty and -- as I think is a theme here -- my vector math always seems to be just a touch insufficient. So, I’m going to write a short series as I go about putting my swarm system together.

I’m not going to go into all of the details right now, but I’m going to roughly follow Craig Reynolds Boid model. A lot of the details aren’t in the original paper and the content in the Wikipedia article is slightly out of line with my memory, so I’m going to bushwack from what I have to a hopefully working swarm system (rather than do more reading right now).

For this doodle, I’m taking my pre-existing moving agent code -- which I always wrote with an eye to doing a swarm system and expanding on it. To start I have little circles that try to balance being between the mouse and the middle of the screen. To build boids we’re going to have to expand that a little and add in a few more things to do.

I’m trying to stay close to Reynolds model for now, although there’s lots of fun to play with later on. I’m going to set up three “urges” for the boids, a separation urge -- “I’d like to not crash”, a heading (or alignment) urge -- “I want to go where everyone else is going” and a cohesion urge -- “I don’t want to be the only one out where I can get eaten”.

I’ve been working on this for a while -- and then not working on it for a while, so I’m starting to write with the intention of kicking myself into finishing the project. I’m about halfway done putting everything together -- which you'll notice when you look at the code in the repository, and I think I’ll write this up in four or five posts over the next few weeks. Once I get the basics done, I’m looking forward to all the other things I can play with.

Saturday, April 08, 2023

A General Update on Code Doodling

Doodle Code is my “knitting” project, where I dabble in programming while watching TV or during family gatherings (hey, it works for my family), and I haven’t had any really goals, so I haven’t had a point to stop and update. It also turns out I’ve been a bit forgetful and messy, but oh well. Now seems like time to dust it off and share it with anyone who’s interested, even if it's not the repository of useful teaching code I'd thought it might be originally.

Graph of Languages for the Github repository, showing Java at 77.1%, Processing at 18.8% and Python at 4.1%.
Can you tell I'm a programmer who did most of his learning in the late 90s and early 2000s?

There are about 15 doodles, in various states of completion. Dunking on the dumb mathematical things sports casters say has been a bit of a theme and beyond that playing with colours. Everything else is things I thought would be interesting or just stuff I’ve been meaning to do (like the Coding Train Challenges).

I’d drifted away from doodling for a while, so back in February I thought it was time to start again. Then I came to the realisation that basically nothing was organised, documented or finished. I’ve started poking at that, but as it turns out it’s more fun to do new things than it is to go and clean up my own mess.

Graph of GitHub Commits showing tjkendon with 251 commits from January 2022, to April 2023, 6739 lines of code added and 1464 lines of code removed.
Github is always good for that endorphin rush of numbers go up.

Each doodle now has at least a description and a Readme, some are better documented than others, but that’s a starting point. I’m trying to strike a balance between working on new stuff and cleaning up what’s there so that it might be useful for someone else at some point. It may not be good for my existing habit of not getting stuff done, but I’m honestly feeling quite happy doodling around with stuff and I’m not feeling that compelled to “finish” anything. I am slowly learning to unlink my feelings of self-worth and happiness from productivity and I must say it’s quite refreshing and the project is leaving me feeling pretty good even if it may not be that actually useful.

Monday, February 28, 2022

Feelings about Set Similarity

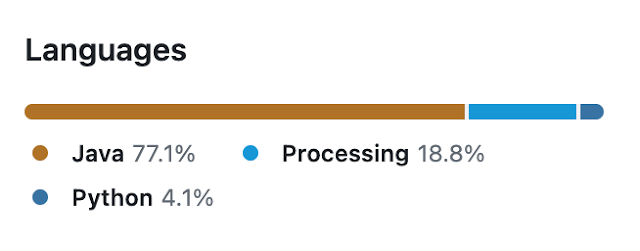
The first tiny program I worked on for Code Doodle was a list difference calculator. It takes two lists and tells you which elements are on both lists or how similar the lists they are. 

I made this mostly to back up my joke that every time you watch any World Cup coverage an English sportscaster will talk about 1966 and how well the English team has done against whoever they're playing since then, despite the fact that ... none of the players are the same. Similarly the record of two NHL teams must be discussed even when there are more players who are playing for the other team than played for the same team after some period of time.  I thought having a program which backs up how ridiculous these types of statements are might be entertaining. As it happens, I also ran into a problem at work that needed me to find which people were on two lists, so it's not just a joke, but it's still mostly a joke.

All this program does is calculate the union, intersection and set difference for the two lists and then calculate how similar the two lists are. This is a bit messy in Java, due to the limitations of the Java Collections API (certainly the Python version of this program would be tiny), but nothing particularly hard to do. It was a fun project, so I wrote it up, wrote up some basic tests, and it seemed good enough.

Later on, when I was adding in the ability to read from a file, I put in two lists that were different than my original lists and thought I must have made a mistake. Even though I thought the two lists should be 50% similar, the program told me that they were 33% similar. 

So I went and checked through my code, my tests and my math. All of those were correct, as for as I could see, so I did what naturally comes next, I asked Google. After a few journeys through Stack Overflow and Wikipedia I managed to get something of an answer. I'm not weird, math is weird. 


Well, I am weird and math is weird.


Different Types of Set Similarity


My intuition when I was writing the program said to me that the similarity of two sets would be the size of the intersection of those sets, divided by the size of the union. If there are 10 total things and 3 of them are on both lists then the two lists should are 30% similar.

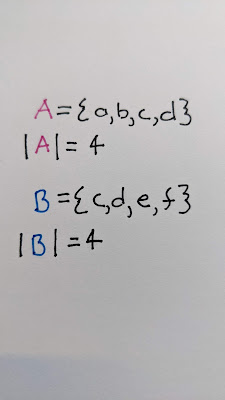
The problem came for me looking at two sets like this:

{a, b, c, d} and {c, d, e, f}

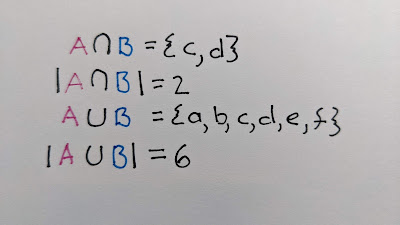
The intersection {c, d} has 2 elements and the union has 6 elements {a, b, c, d, e, f}, so by my reckoning above, the two sets are 33% similar. When I came back to it, my intuition said since each list has half unique elements and half common they should be 50% similar. So I had two "intuitive" results, both of which seemed to be mathematically correct, but which "felt" right in different contexts.

I should probably have done some reading first, but this wasn't a reading first kind of project. Once I did start reading I was at least pleased to discover that I'd done my math right.


Jaccard Coefficient


For my first calculation of similarity, I had stumbled upon the Jaccard coefficient (or the Jaccard index), which is the ratio of the size of the intersection to the size of the union.


A diagram of letters a - f with a - d grouped in a pink circle and d - f grouped in a blue circle.

Mathematical Notation: A = {a, b, c, d}, |A| = 4, B = {c, d, e, f}, |B| = 4

Mathematical Notation: Intersection of A and B = {c ,d}, Size of Intersection of A and B = 2, Union of A and B = {a, b, c, d, e ,f}, Size of Union of A and B = 6


Mathematical Notation: Jaccard coeefficient is the size of the Intersection of A and B divided by the size of the Union of A and B. This is equal to 2 divided by 6, which simplifies to 1 divided by three or 0.33


The Jaccard Coefficient has you figure out  the percentage of elements that are in both sets out of the all of the possible elements. This makes sense for a lot of sense for a lot of applications, for example if you want to see how similar two photos are for example you can see how many of the pixels are the same and the more similar pixels the more similar the photos should be. Because it focuses on on the intersection compared to all elements it makes the most sense when you're considering the whole space of the elements, rather than a specific set of those elements.

The problem here is that it doesn't suit my primary goal, which is to be able say that 22% of the 2014 English Men's football team returned to play in the 2018 English Men's football team. Instead the Jaccard coefficient tells me me that 5 out of the 44 people who played football for England in 2014 and 2018 played in both.So while it's an accurate measure of similarity for a lot of purposes, it doesn't tell us as much about the overlap between the two sets we're looking at.


Sørensen–Dice coefficient 

I learned all that about the Jaccard Similarity while I started searching for the "right answer". Did I do the math wrong? No. Did I build a meaningless measure? Not that either. Thankfully after that I found the Wikipedia entry that introduced the Sørensen–Dice coefficient. For Sørensen–Dice, instead of looking at the elements in the intersection compared to all the elements, we're looking at the size of the intersection compared to the average size of the two sets.


Mathematical Notation: Sørensen–Dice coefficient is = 2 times the size of the intersection of A and B divided by sum of the sizes of A and B. This is equal to 2 times 2 divided by 4 plus 4, which resolves to 4 divided by 8, which simplifies to 1 divided by two or 0.5


Since we're now saying that 2 out of the 4 elements in either of the sets are the same, we get much closer to that feeling I was looking for. Now if we have 5 out of the 22 members on the 2014 English Men's football team repeat as 5 out of the 22 members on the 2018 English Men's football team, then the two teams are 22 % similar, as opposed to the 12% Jaccard would suggest. 

For our example we now have 2 of the 4 in each set so a 50% similarity as opposed to the 33% similarity from the Jaccard coefficient and I think this produces a more intuitive measure for the kind of application I'm intending here. 


Szymkiwicz-Simpson Coefficient

While I was at it, I also discovered the Szymkiwicz-Simpson coefficient, which is also called the Overlap coefficient. This is almost the same as the Sørensen–Dice coefficient, but instead of - effectively - looking at the average size, we're comparing the size of the intersection to the size of the smaller set. This reframes the question a little bit into how much of the smaller set appears in the larger set.


Mathematical Notation: The Symkiwicz-Simpson coefficient is equal to the size of the intersection of A and B divided by the minimum of the size of A and the size of B, this resolves to 2 divided by the minimum of 4 and 4, which resolves to 2 divided by 4 which simplifies to 1 divided by 2 or 0.5


The big difference between Szymkiwicz-Simpson and Sørensen–Dice is that for sets with a large size difference the Sørensen–Dice will be higher. So the focus (as the name Overlap implies) is really focused on the overlap vs the overall similarity. Since for most of the data I'm playing with, the two sets are pretty similar in size there's really no effective difference between the two, but I'm sure in different applications, the difference might be really helpful. (For example: Is it more remarkable that two people were both in classes of 100, or more remarkable that they were in a class of 100 and a class of 10?)


If we take the same basic set of six elements and slightly reorganize the two sets we're comparing we can see real differences in the outcomes.


A diagram showing the letters a - f with one set containing {a, b, c} and the other set containing {b, c, d, e,f}

Mathematical Notation: Set A contains elements a, b and c, the size of set A is 3, Set B contains elements b, c, d, e, f, The size of Set B is 5.

Mathematical Notation: The intersection of Sets A and B is b and c, The size of the intersection of sets A and B is 2, The Union of sets A and B contain a, b, c, d, e, f, the size of the union is 6.

Mathematical Notation: The SS coefficient = size of the intersection of A and B divided by the minimum of the size of A and the size of B, this resolves to 2 divided by the minimum of 3 and 5, which resolves to 2 divided by three or 0.67, the SD coefficient is equal to 2 times the size of the intersection of A and B divided by the sum of the size of A and and the size of B, this resolves to 2 divided by 8, which simplifies to 0.5, the J equals the size of the intersection divided by the size of the union of A and B, which resolves to 2 divided by 6, which simplifies to 1 divided by 3 or 0.33


Feelings about Set Similarity

In short this is a silly project. It is entirely based out of me having listened to too many sports-casters say dumb statistical things. (Don't get me started on the "Data Science" of restricting events to such a ridiculous extent that you can find the most shots made by a left-handed player in the odd minutes of the second half of a game.)

I'm sure in *most* applications of similarity measures, there's something which will indicate what the right measure is for the application. Jaccard and Sørensen where both working in ecology and populations (and I think Szymkiwicz was as well) and so depending on what question they were looking at, the both make sense for comparing different populations. In computer vision, Jaccard makes a lot of sense for checking if two images are the same, but Szymkiwicz might make more sense to see if a smaller picture is part of a bigger one.

For my purposes, the primary answer is feel. Does it feel like the 2014 English Mens football team is more similar to the 2018 or the 2010? So even while math might leave me to lean on Jaccard, the other two feel like a better fit.

I actually ran a twitter poll on the topic (and thank you to all 5 people who answered ... it was a weird poll).


The results of the poll showed a split and I can't say anything at all other than to suggest that depending on your background and your purpose the way these measure "feel" is different. So when you're writing a program or analyzing data, it's worth thinking about how someone looking at your output is going to feel when the look at your results. Are they going to align with how they think about the problem and how they think about the data?

For my list difference calculator, I decided to avoid making a decision and added the options to calculate any of these three different similarity measures.


Tuesday, January 18, 2022

Project 21 - Code Doodle - Introduction

 As I've mentioned in my last few updates I'm starting to get a little bit more done on some of my *other* projects. Despite my best efforts though, some of those projects are big, and hard to finish and they need me to learn things, even when I think I've kept them small. 


The solution to that is *clearly* to start doing something else as well. Because spreading myself thinly has really been a key to my success. 


Oh.


Right.


No, it's definitely the other thing where I'm not great at finishing things and it's easier to play with the new shiny thing than it is to get shit done.


That being said, I am starting a new project and I have a bunch of ideas whey I think it's a good idea.


Ok Fine. I'll bite, what are you doing?

I'm writing a bunch of tiny programs. They may help me do other jobs or they may just be things that seem cool to play with. Basically, I want them to be simple, easily completed, code doodles.

A cartoonish drawing of the word Code surrounded my some doodles of squares, lines and toast.


You Mentioned You Had Ideas as to Why This Wasn't a Bad Idea

Aha. Actually I said I have ideas as to why this is a *good* idea. Take that, Scalziesque interlocutor!

Still.

The biggest reason I want to write tiny programs is that I want to write tiny programs. I don't write that many programs and programming is fun.Sometimes your brain is a little bit on automatic and you want to engage it just enough to to have done something. It's knitting basically. Programming, fun times.

The second reason is that I'm working on *another* project, related to teaching people to code and I think one of the things we do very poorly when programming is teaching new programmers to read other peoples' programs. I've never had time when I'm teaching to get beyond the bare basics of what I need written for the students to work with, and so this seems like a great time to just build up a repository of interesting programs so that people can *look* at them at some point. In fact, at some point, I hope to have other people contribute interesting tiny programs too. (I don't know what that point is, so if you're interested in publicly sharing the code for a tiny program, drop me a line.)

The third reason is that there's a ton of things I still need to learn. Also there's a not insignificant list of things I've forgotten to a greater or lesser extent. And much as I hope Game Tracker will be great for teaching me, it's *already* too big and complicated for what I'd hoped to do for a lot of things and I need some places to play before I build those things.

The fourth reason is just to give myself practice finishing things. I'm bad at it. I've been bad at it for most of my life and so keeping the programs tiny seems like a good way to finish them.

The fifth (and for now final) reason is that it's a fun way to run into more interesting things I haven't had a chance to think about before. For example, how similar *are* the sets of {1, 2, 3, 4} and {3, 4, 5, 6}. So the fifth reason really ties the other together a bunch of the others in a way that should hopefully keep my brain moving.

So What Are You Doing?

I've made a GitHub repository and I'm uploading stuff there. No guarantees any of it's good or interesting (and if I've solved any of your intro to programming assignments by accident, (Sorry!) I'm not doing it on purpose. - Hit me up and we'll chat assessments in programming.) Feel free to keep an eye on it if that's the kind of thing that interests you.

So far I have 2 programs in the repo.
  • List Difference - takes a look at two lists and lets you see how similar they are. It's intended to help statistically mock sports casters. This one's pretty finished.
  • Food-o-rac-o-cycle - named for the food machine on the Jetsons (I think). This will tell me what to make for breakfast. This one's off to a good start.
I'm also planning to add a couple of other programs that I'm working on to help with the Chrono Sprites. I started them separately, but they fit the model for Code Doodling, so I'm going to drop them in too.

I'll update from time to time, but if you're interested in what I'm up to looking at the repository is probably the best place to see the latest.


Tuesday, July 16, 2013

Project 4: A Further Surprise Snake Update (Version 0.2.0)

So it seems I still have a lot of procrastinating to do. I've managed to turn out another version of Snake. (This time version 0.2.0).


This version introduces:

* Awful Sound Effects - it's weird old beeps, that kinda appealed to me
* Mute - press 'M' to turn off the awful sound effects (this doesn't preserve between games yet)
* Scaling Snake Colour - now as the snake grows it fades to grey towards the end of it's tail. This makes it easier to see which way you're going (especially when coming back from pause).

Please play and let me know in the comments if you run into any problems or bugs or any thoughts at all really.

You can get the game from these links:


Thanks as always!

Monday, July 01, 2013

Project 4: Snake: Update and Wrap-up

It may have taken me nearly a year to do a few afternoon's worth of programming, but the first version of my Snake game is finally done. (Spoilers: You can play it using the links at the bottom of the article.)


This was quite a bit of fun to put together. One of the nice things about programming a game (especially one this simple) is that the results are immediately visible. It's also nice to have small targets to hit that are fairly easily achieved.

The game plays pretty much like any instance of snake you may have run across in the past. I did choose to have the edges of the world wrap because I was entertained by the math, but I also enjoy that it does cause you to think a little extra since the snake is not always apparent as adjacent to you. Right now the game speeds up for levels 1 - 10, but the game doesn't end until you reach level 33.

For the record though you can technically win the game, however I'm not sure how possible that is in reality. I've found the responsiveness with my Mac Book Pro to be insufficient at the higher levels, but with a different key board it may be easier. It's also somewhat difficult because there's no boarder around the snake and so it's very difficult to see where the snake is at any given point in time.


I'm pleased with the level and score markers that pop up. It would be nice to have them fade in or out, or for the scores to bounce a little. I decided to stop where I got to and if I'm able to put those in as extras in a later version. Additionally in later versions I'd like to add some game modes and manage difficulty better than I am right now.

I'd really appreciate some help testing out this version of the game. If you have a little time I'd like to know:

  • if/how it works on different platforms (links are below)
  • if there are any bugs
  • is it fun? What could make it more fun?
Comments in the comment section would be appreciated.

For now it needs to be downloaded, it's not really worth making it embeddable.
Control the snake with your arrow keys. You can quit with the 'q' key and win with the 'w' key. From the game over screen you can start playing again by hitting the space bar.

These should all run with the included files. Processing has an automatic generator and I've found that the Windows and Mac versions seem to work for me. I haven't had time to test it on Linux yet.

Thanks for your support. I'll do another version but for now it's on to other things!


Reading

I’m not sure that anyone, myself included, really needs this post. On the other hand, I read a thing about re-reading and I want to write ab...